


Table of contents
Part 1 - What Are Fibonacci Levels in Trading Forex?
Part 2 - Common Fibonacci Level Mistakes in Forex
Part 3 - Correct Fibonacci Drawing Method
Part 4 - Which Timeframe Is Best for Fibonacci Levels?
Part 5 - Retracement vs Extension in Forex Trading
You’ve been plotting your trades with confidence, but here’s the hard truth: Your Fibonacci Levels Are Probably Wrong. If you've ever scratched your head watching price blow right past your retracement zones, you're not alone. Most traders think they’ve nailed it—until they’re stopped out and wondering what went sideways. It’s not that Fibonacci doesn’t work—it’s that most folks are drawing it like a game of connect-the-dots with no real logic.
A seasoned trader once said, “Fibonacci isn’t magic—it’s math, and it needs context.” The market doesn’t care about your textbook setup if it's built on shaky ground. Messy entries, false signals, and chasing candles? That’s what bad Fibonacci use gets you.

This guide cuts through the fluff. You’ll see where traders mess up, how to fix it, and what tools actually help—not just look cool on a chart. Let’s clean up your levels so your trades stop getting wrecked.
1. What Are Fibonacci Levels in Trading Forex
"If I had to credit one concept that shifted the way I approached forex trading, it would be Fibonacci levels," said Marcus LeBlanc, a New York-based forex educator who previously led institutional trading desks in London and Tokyo.
Fibonacci levels are not an invention of modern-day trading platforms. They are rooted in the fibonacci sequence, a series of numbers where each number is the sum of the two before it. This sequence leads to a universal mathematical ratio known as the golden ratio, or approximately 1.618 — a value that appears across nature, architecture, and, yes, even financial markets.
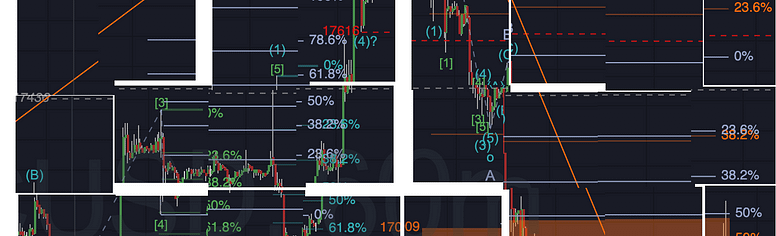
In the context of forex trading, Fibonacci levels are used to identify potential reversal zones, trend continuations, and support and resistance points. Traders apply these levels on price charts using tools that highlight retracement levels (such as 23.6%, 38.2%, 50%, 61.8%) and extension levels (like 127.2%, 161.8%, 261.8%) to frame trading decisions.
Why Traders Use Fibonacci Levels
Retracement Levels: Used to spot potential pullback zones before a trend resumes.
Extension Levels: Help forecast where price may go after a breakout or trend continuation.
Price Action Structure: Offers traders a non-arbitrary method for planning entries, stop-losses, and take-profits.
Support and Resistance Guidance: Acts as an additional confirmation tool, especially when paired with moving averages or candlestick signals.
According to a 2023 OANDA user survey, over 65% of intermediate traders cited Fibonacci levels as their most-used technical analysis tool after moving averages and RSI. That usage is not without reason.
“People often ask, 'Do Fibonacci levels actually work?' And I tell them, they work when you understand why they work,” LeBlanc explained. “They reflect human behavior — and forex markets are driven by emotion and math.”
Even institutional analysts from firms like IG and FXCM continue to train new recruits on how to anchor Fibonacci levels to major swing highs and lows. They are especially effective when combined with other market analysis tools, reinforcing both risk management and strategic timing.
Real Use Case
When trading the EUR/USD pair, for example, a trader might observe a recent bullish swing from 1.0650 to 1.0850. Using Fibonacci retracement, they mark key levels such as 1.0780 (38.2%) and 1.0750 (50%) to identify likely zones of support if the price starts to pull back. These retracement areas help the trader decide whether to enter, wait, or exit based on current momentum.
In the end, Fibonacci levels are not magic. They are a technical analysis framework grounded in both mathematics and crowd psychology. They are used by everyone — from day traders tracking micro price moves to swing traders planning weeks ahead.
Backed by centuries-old math, supported by modern platforms, and trusted by market veterans — Fibonacci levels continue to shape the structure of smart, informed trading strategy in the high-stakes world of forex trading.
2.Common Fibonacci Level Mistakes in Forex
Placing Levels Without Price Context
Many traders slap Fibonacci levels on a chart without even asking, “Where does this price actually matter?” That’s a problem. Fibonacci isn’t magic — it relies on real support and resistance zones that price respects. If your horizontal levels don’t align with key price levels from previous swings or breakouts, they’re basically noise.
Start with these:
Identify previous highs and lows that caused reactions.
Match Fibonacci anchors to clear, logical price points.
Avoid plotting levels in a price vacuum — context is everything.
“Fibonacci works best when it mirrors the market’s memory,” says FXEdge analyst Mark Hutchins. “That means placing it where price has actually mattered before.”
So don’t just drop lines on a chart — do proper chart analysis first, and ensure each level reflects where traders historically stepped in.
Using Default Fibonacci Settings Only
Too many beginners rely solely on the default settings provided by trading platforms — typically the 23.6%, 38.2%, 50%, and 61.8% levels. While these Fibonacci ratios are foundational, they don’t always fit today’s volatile market environments. Using only standard settings can limit your accuracy and adaptability.
Sometimes, custom settings help reveal market behavior more clearly. Here’s a simple table to guide your adjustments:
| Fibonacci Level | Purpose | When to Adjust |
|---|---|---|
| 38.2% Retracement | Shallow corrections | Strong trends |
| 50% Retracement | Neutral correction zone | Low volatility phases |
| 61.8% Retracement | Major reversal threshold | Sharp pullbacks |
| 127% Extension | Moderate profit targets | Breakouts with hesitation |
| 161.8% Extension | Full breakout projection | Trending confirmation |
The takeaway? Fibonacci levels are tools, not gospel. Modify them based on your market analysis and trading style — especially when using technical indicators alongside them.
Misreading Reversals as Retracements
This one messes with traders all the time: thinking a reversal is just a retracement, or vice versa. Here's the difference — a retracement is a pause in trend, a breather. A reversal is when the entire market trend flips. If you don’t know which one you’re looking at, you’ll enter too early... or way too late.
Here’s how to spot the difference:
Retracement:
Price pulls back, but stays within the original trend structure
Often aligns with Fibonacci retracement levels (38.2%, 50%, 61.8%)
Supported by indicators like RSI staying above/below midline
Reversal:
Breaks the previous swing high/low
Shows declining momentum in the original trend direction
New market direction is confirmed with price action and volume
Real traders know: always confirm with trend analysis and trading signals. That small pullback might be the start of something bigger — or just a fakeout before the trend charges on.
Bottom line: Misreading the situation leads to wrong entries and busted trades. Learn the price behavior and don’t just trust what looks like a dip.
3.Correct Fibonacci Drawing Method
Anchoring Fibonacci to Market Swings
If your Fibonacci levels are off, chances are you’ve anchored them to the wrong part of the chart. In technical analysis, especially with Fibonacci retracement and Fibonacci extension, the anchor points you choose—those key swing highs and swing lows—determine everything.
Think of these swings like the bones of the market’s movement. If you misplace them, your structure collapses.
Here’s how to properly anchor Fibonacci to market swings:
Identify the trend direction first (uptrend or downtrend). Use tools like trendlines or simple price action.
For an uptrend, anchor from the swing low to the swing high.
For a downtrend, anchor from the swing high to the swing low.Confirm the anchor levels with support and resistance zones or volume clusters to ensure they aren’t arbitrary.
Use Fibonacci levels (38.2%, 50%, 61.8%) to spot potential price pullbacks or breakout zones.
“You can’t force Fibonacci onto the market—let the market show you where to place it,” advises Kathy Lien, Managing Director at BK Forex.
This approach aligns your trading strategy with natural market swings, improving your ability to forecast price levels accurately.
Using Wicks vs Body for Anchors
Ah yes, the classic debate in candlestick charting: should you draw your Fibonacci levels from the wicks (the highs/lows) or the bodies (open/close)?
Here’s the straight talk: there’s no single rule—you choose based on what the market is doing and how price is behaving.
Use wicks when the market is volatile and you want to account for sharp reactions or emotional spikes in price.
Use bodies when the market is stable and you’re trying to get clean, consistent anchor points that reflect real intent from traders.
Here’s a quick comparison:
| Situation | Use Wicks When... | Use Body When... |
|---|---|---|
| Reversal patterns | Candle tails show false breakouts | Body closes confirm shift in trend |
| Trend formations | You want to capture entire range | You want cleaner trend anchors |
| Scalping environments | Market reacts quickly | Precise entries based on closes |
Using the high price or low price (wicks) gives you a broader range. But anchoring from the open price or close price (body) helps eliminate noise in consolidating markets.
The key? Stay flexible. You don’t want to be the trader who’s stubbornly anchoring to candle wicks while the market’s quietly trending based on body closes. Match your method to the chart patterns and the trading environment you're in.
4.Which Timeframe Is Best for Fibonacci Levels
Fibonacci on Daily Charts
The daily chart is one of the most reliable timeframes for plotting Fibonacci retracement and Fibonacci extension levels. This timeframe reduces noise, helping traders focus on the broader market structure and long-term support and resistance zones.
Many traders rely on swing highs and swing lows from daily charts to establish key price levels that influence decisions across shorter timeframes. This makes it ideal for trend-followers and position traders.
Helps identify dominant trends through clean technical analysis.
Reduces false signals seen in lower timeframes.
Useful for spotting potential entry zones during pullbacks.
This approach suits those who trade less frequently but aim for larger, more calculated moves based on strong trend analysis.

Using Fibonacci for Scalping Forex
Scalping in Forex using Fibonacci levels is fast, intense, and not for the faint of heart. Scalping strategies aim to capture small price movements — often within minutes — so the right use of Fibonacci tools can create sharp entry points, exit points, and help manage risk-to-reward ratios.
This strategy relies on identifying quick reactions around Fibonacci levels, often on the 1-minute or 5-minute charts, especially in highly liquid currency pairs.
Here’s a quick guide for scalping with Fibonacci:
Start with the 5-min chart and mark recent swing highs/lows.
Draw Fibonacci retracement levels to track price action pullbacks.
Confirm with candlestick behavior or volume spikes.
Set tight stop loss and take profit zones — and act fast.
This method pairs well with traders who enjoy intraday trading and can make snap decisions based on fast market moves.
H4 Timeframe Trend Analysis
The H4 timeframe (4-hour chart) hits the sweet spot between daily trend clarity and intraday flexibility. It’s perfect for swing trading, providing a broader look at the trend direction without requiring daily chart patience.
Use H4 to:
Identify trend continuation using moving averages or momentum tools.
Overlay Fibonacci retracement on recent impulsive moves.
Align support levels and resistance levels with price clusters or key reactions.
This is where your trades mature. You get enough signal strength without dealing with the whipsaw of shorter charts.
“If the daily shows the story, the 4-hour shows the scene-by-scene breakdown.”
— Jordan Keyes, Senior Analyst at Apex Charts
Multi-Timeframe Fibonacci Confirmation
This strategy combines multiple timeframes to validate Fibonacci confluence zones — where levels from different timeframes overlap, strengthening the confirmation signals.
Rather than relying on a single chart, traders compare levels across at least two timeframes to validate the trading setup.
Here’s a quick breakdown of how this works:
| Timeframe Layer | Purpose in Strategy | Use in Practice |
|---|---|---|
| Daily Chart | Identify the major trend | Map long-term Fib retracement zones |
| H4 Chart | Spot swing moves | Draw refined retracements/extensions |
| M15 Chart | Execute the trade | Confirm entries, place stops |
Multi-timeframe setups provide risk management through stronger alignment. When Fibonacci levels across timeframes converge, you’re looking at a zone with high probability of reaction — a prime opportunity for strategic entries or exits.
This style is ideal for traders who want to increase confidence and lower risk by combining big-picture context with short-term execution precision.
5.Retracement vs Extension in Forex Trading
When to Use Retracement Levels
Fibonacci retracement levels are your go-to tool when the market pulls back before continuing in the same direction. These levels — like 38.2%, 50%, and 61.8% — act as key support and resistance zones within a trending market.
They’re especially useful when:
You’re trading in an uptrend or downtrend, and the price starts to retrace.
You need to identify possible entry points during a technical correction.
You're combining retracement levels with indicators like moving averages or RSI to confirm setups.
For example, if EUR/USD rallies and then drops to the 61.8% retracement level, and RSI is oversold, that’s a potential bounce zone. This method roots your decision-making in technical analysis, not just guesswork.
Every trader's chart might look a bit different, but if you're just throwing levels on there without checking the trend or confirmation from price action — you're basically driving without headlights.
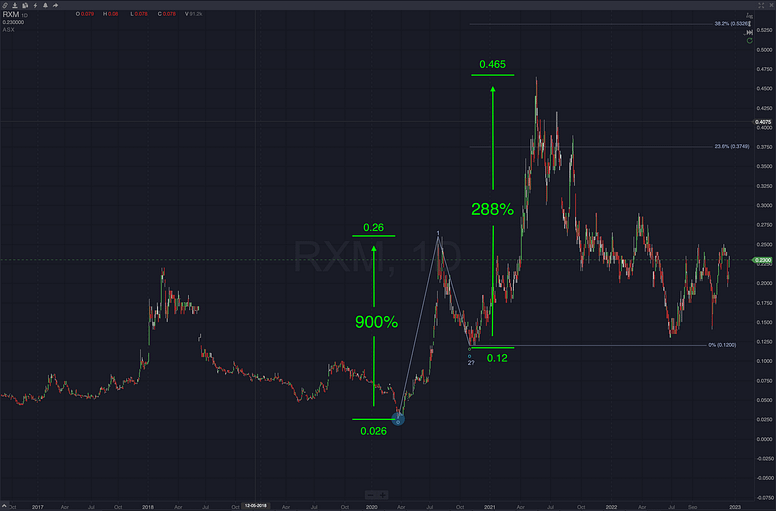
Spotting Extensions After Breakouts
When price action explodes through a previous resistance level with high volume, Fibonacci extension levels can help you forecast the next target zones — long before the rest of the market figures it out.
Here’s a practical way to apply extensions:
Identify a clean breakout — look for a surge in volume and a break above a consolidation range or major resistance.
Draw your Fibonacci from the previous swing low to swing high (for bullish setups).
Mark the extension levels (typically 1.272, 1.618, 2.0, and 2.618). These are future resistance levels or profit targets.
According to Jordan Keen, a pro forex analyst at DailyFX:
“Fibonacci extensions aren’t magic, but they give structure to chaos. Especially when the market’s moving fast and traders are scrambling for price targets.”
Below is a table showing common Fibonacci extension levels and how they relate to potential price movement expectations:
| Extension Level | Multiplier | Market Sentiment |
|---|---|---|
| 1.272 | Mild extension | Moderate momentum continuation |
| 1.618 | Golden ratio | Strong trend, high confidence |
| 2.000 | Double move | Aggressive breakout play |
| 2.618 | Extreme target | Overextended or euphoric move |
Always remember: not every breakout will hit 2.618 — but when it does, you’ll be glad you had your levels ready.
6.What Indicators Support Fibonacci Trading Best
Combining Fibonacci with RSI
The RSI (Relative Strength Index) is a solid partner to Fibonacci retracement levels. Why? Because it adds momentum clarity when price nears a retracement line.
Here’s the deal:
When RSI is above 70 (overbought), and price hits a Fibonacci resistance, it could mean a reversal's coming.
Below 30 (oversold) at a support level? You might be looking at a solid bounce play.
Pairing these tools helps spot real entry points and avoid emotional trades. Chart patterns get cleaner, and your trading strategy gets tighter when RSI confirms a retracement zone.

MACD Confirmation of Fibonacci Zones
MACD + Fibonacci? That’s a smart way to trade like a technician. The MACD (Moving Average Convergence Divergence) shows momentum and trend direction — perfect to confirm Fibonacci zones.
Here’s how you use it:
Draw Fibonacci levels from a recent high to low (or vice versa).
Watch MACD for a bullish crossover near a retracement level — that’s your signal to enter.
If MACD lines up with the Fibonacci bounce, you get extra confirmation for timing.
Also, MACD divergences help you sniff out false breakouts. It’s like having a second opinion before pulling the trigger.
Bollinger Bands and Fibonacci Synergy
When Fibonacci levels intersect with Bollinger Bands, you're in high-probability territory. This combo reads volatility and price structure at once — a powerful edge in forex trading.
Use this three-step scan:
Check if price is touching a Fibonacci level and the outer band at the same time.
A tight band width = upcoming breakout potential.
Watch for price rejection at the level + band = potential reversal.
Here’s a quick comparison table to see how they work together:
| Tool | Primary Role | When to Use Together |
|---|---|---|
| Fibonacci Levels | Identify retracements | Major swing highs/lows |
| Bollinger Bands | Measure volatility | Detect price compression or expansion |
| Combined Strategy | Confirm reversals/breaks | Entry when both tools align |
The synergy gives you structure and flexibility — a big win in unpredictable markets.
7.Best Platforms to Use Fibonacci Levels Accurately
Fibonacci Tools in MetaTrader 4
MetaTrader 4 (MT4) has long been the standard for forex traders using Fibonacci retracement and extension tools. It offers solid functionality for both manual and automated strategies.
Built-in Fibonacci retracement and Fibonacci extension tools are available under MT4’s charting tools. You can easily draw from swing highs to swing lows with pixel-level accuracy.
Customize levels (like 38.2%, 61.8%) and label them with prices, percentages, or both. Templates let you reuse setups.
With MQL4, you can create Expert Advisors (EAs) that apply Fibonacci logic automatically across various currency pairs and timeframes.
Traders can use drawing objects like trendlines and parallel channels alongside Fibonacci levels for confirmation. Though the interface is a bit dated, the power lies in its reliability.
TradingView Custom Fibonacci Scripts
If you’re a visual learner or a code tinkerer, TradingView gives you serious power to bend Fibonacci tools to your will.
Use Pine Script to create custom Fibonacci indicators — from retracements to complex zones.
The script editor includes version control and backtesting for strategy validation.
Community scripts give access to thousands of trader-tested Fibonacci-based setups, all shareable with a click.
With its slick charting and alert systems, TradingView is ideal for traders who like to automate parts of their strategy and visualize data cleanly.
“Fibonacci is just math, but on TradingView, it becomes art.” — Jake Smith, FX Technical Strategist
cTrader Precision Drawing Options
For traders who demand surgical precision, cTrader is a rock-solid platform. Its intuitive drawing interface makes it ideal for clean Fibonacci setups.
All drawing objects — including Fibonacci retracements, extensions, and expansion tools — can be snapped to exact open, high, low, or close values.
You can lock drawings to avoid unintentional changes while adjusting charts.
The platform supports full customization: angles, scale, coordinates, and background overlays.
Here’s how cTrader stacks up in terms of drawing precision:
| Feature | MetaTrader 4 | TradingView | cTrader |
|---|---|---|---|
| Snap to Candlestick Points | Moderate | Good | Excellent |
| Lock Drawing Function | Limited | Yes | Yes |
| Precision Control Settings | Basic | Advanced | Highly Detailed |
Whether you’re scalping or swing trading, cTrader’s advanced drawing options let you fine-tune your Fibonacci plots to perfection.
Mobile Apps with Fibonacci Support
Don’t let the small screen fool you — mobile trading apps now support serious Fibonacci charting power.
Top-tier broker apps like OANDA, IG, and FXTM on iOS and Android allow you to draw Fibonacci retracements directly on touchscreens.
Sync across devices means you can prep on desktop, then monitor and adjust on your smartphone or tablet.
Many apps include real-time data, technical indicators, and pinch-zoom charting, so you’re not missing out on analytical depth.
Some apps even let you save custom templates and anchor your Fibonacci tools with finger-drag accuracy — no stylus needed.
If you're stuck in traffic or waiting for a latte, you can still trade Fibonacci like a boss.
Conclusion
Turns out, a lot of traders are just drawing Fibonacci levels and hoping for the best—like throwing darts in the dark and calling it strategy. If that’s you, no shame—we’ve all been there. But it’s time to tighten up the game: right anchors, right timeframes, and the right tools can flip your results fast.
As trading coach Linda Raschke said, “Discipline trumps conviction.” So ditch the guesswork and start drawing with purpose.
There’s no universally "best" Fibonacci level, but the 61.8% and 38.2% levels are most commonly used by forex traders. These levels often align with significant support/resistance points, making them effective in trending markets.
Fibonacci levels fail when traders rely on them in isolation. Market structure, news events, and volume often override historical price behavior. Treat Fibonacci as a supporting tool, not a guaranteed predictor.
Start from swing high to swing low (or vice versa)
Align to candlestick wicks for precision
Confirm the trend direction before plotting
Avoid drawing in sideways or choppy markets
MetaTrader 4/5: Built-in Fibonacci retracement tools
TradingView: Advanced customization and scripts
cTrader: Clean interface with precise plotting
NinjaTrader: Extensive drawing and backtesting features
Fibonacci levels can be useful in day trading, especially on the 15M, 30M, and 1H timeframes. However, accuracy depends on the strength of the trend and how disciplined your entry and exit strategy is.
Yes, many modern trading apps offer Fibonacci tools, including:
These platforms allow traders to draw, adjust, and analyze Fibonacci levels on-the-go, though functionality may be more limited than desktop versions.
MetaTrader mobile
TradingView mobile
cTrader mobile
Yes, many professional traders use Fibonacci retracement — not as a standalone method, but as part of a broader strategy that often includes:
Trend analysis
Volume confirmation
Candlestick patterns
Confluence with other indicators

