


Table of contents
Part 1 - What Is Technical Analysis in Forex Trading?
Part 2 - Forex Technical Indicators Guide
Part 3 - How to Analyze Forex Charts Effectively?
Part 4 - Popular Forex Technical Strategies
Part 5 - Which Is Better: Technical or Fundamental Analysis in Forex?
Part 6 - Technical Analysis Tools for Forex Traders
Part 7 - Can Technical Analysis Improve Your Forex Trading Success?
Ever feel like forex trading is just tossing darts in the dark? You're not alone. What is Technical Analysis in Forex? It’s the trader’s flashlight—using price charts, patterns, and indicators to make sense of the chaos and spot real opportunities, not just guesses.
It’s like reading a map before a road trip. “The trend is your friend,” as traders say. Instead of gambling, you’re analyzing—making smarter calls based on what’s already happened in the market.
Most folks don’t lose trades because they’re unlucky. They lose because they trade blind. This guide lays out the tools, charts, and strategies that can change that—fast.

1. What Is Technical Analysis in Forex Trading?
“When people ask me how I started making consistent profits in forex,” says Peter Langston, a professional currency analyst with over 15 years of experience on Wall Street, “my answer is always the same—you have to trust the charts. Price action does not lie. It reflects everything.”
Technical analysis in forex trading refers to the approach of evaluating currency price movements based on historical market data. It focuses less on economic reports or global news, and more on the visual behavior of price over time. This includes identifying patterns, analyzing price action, reading charts, interpreting indicators, and locating support and resistance zones. For traders looking to base decisions on evidence rather than speculation, technical analysis offers a system rooted in measurable trends.
Core elements of technical analysis include:
Candlestick patterns that represent price action visually and help traders understand market sentiment
Indicators like RSI (Relative Strength Index), MACD (Moving Average Convergence Divergence), and Bollinger Bands, which signal momentum shifts, trend strength, or overbought/oversold conditions
Support and resistance levels where price historically reacts—either bouncing or breaking through
Volume analysis to confirm whether a price move is backed by strength or likely to fade
“I remember the first time I identified a double top pattern correctly,” shares Daniel Okafor, a retail trader and founder of a forex mentoring group. “It felt like I had cracked the market’s code. The price reversed almost exactly where the charts told me it would. From that day, I never looked at the market the same way again.”
Technical analysis does not claim to predict the future with certainty. Instead, it provides a framework for understanding what is likely to happen based on repeated behaviors in the market. When traders analyze the historical data, they are searching for patterns and trends that have shown consistency. These tools do not replace a trader’s judgment, but they refine it.
This method is not limited to independent traders. Financial institutions, hedge funds, and even central banks use technical analysis as part of their strategy. Bloomberg, Reuters, and other major media outlets often include technical commentary alongside market updates, lending authority to this approach. Platforms like MetaTrader and TradingView, both winners of industry awards, offer built-in access to dozens of tools for technical analysis. These tools are trusted by thousands of traders worldwide.
By relying on visual clues and consistent patterns, technical analysis helps traders build structured strategies, manage risk, and respond more confidently to price movements. While no tool is perfect, the method continues to be a trusted backbone for forex traders who want to make decisions based on clarity rather than guesswork.
“Price always remembers,” Peter says, tapping the edge of his monitor. “Your job is to learn its language.”
2.Forex Technical Indicators Guide
Moving Averages for Forex Trends
Moving Averages (MAs) are the bread and butter of trend-following strategies in forex. They smooth out price data to help identify the direction of the market over a given period. Two of the most widely used are:
Simple Moving Average (SMA): Calculates the average price over a set number of periods.
Exponential Moving Average (EMA): Gives more weight to recent prices, making it more responsive to market moves.
A popular trading strategy is the crossover method. When a short-term EMA (like the 9-day) crosses above a long-term EMA (like the 21-day), it often signals a buy opportunity. Conversely, if it crosses below, traders may consider selling.
“The moving average isn’t perfect—but it’s a solid guidepost. It helps you follow the smart money.” — John Carter, Trader & Author
MAs work especially well on currency pairs like EUR/USD or GBP/JPY and are a key part of many technical analysis systems.
How RSI Identifies Market Momentum
The Relative Strength Index (RSI) is a powerful momentum oscillator that gives clues about when a currency pair is likely to reverse direction. It’s calculated based on the magnitude of recent price changes.
Here’s what the RSI tells you:
RSI > 70 → Overbought (Price might be due for a pullback)
RSI < 30 → Oversold (Could bounce soon)
Divergence → When price and RSI move in opposite directions, a trend reversal may be near
RSI is loved by traders because it's simple but surprisingly accurate. Pairing RSI with trend indicators like moving averages can filter out bad signals and sharpen your entries. This technical indicator is a go-to tool for day traders and swing traders alike.
Understanding MACD Signal Lines
The MACD (Moving Average Convergence Divergence) is a multi-purpose technical indicator used to gauge trend direction, strength, and momentum. It consists of:
MACD Line: Difference between two EMAs (typically 12- and 26-day)
Signal Line: 9-day EMA of the MACD Line
Histogram: Visual difference between the MACD and Signal Line
MACD is especially useful when the lines cross:
MACD Line > Signal Line → Bullish crossover (possible buy)
MACD Line < Signal Line → Bearish crossover (possible sell)
Histogram bars growing → Momentum is increasing
MACD is often used with the zero line as a trend filter: crossing above suggests bullish momentum, while dropping below hints at bearish pressure.
MACD Component Breakdown
| Component | Function | Signal Type |
|---|---|---|
| MACD Line | Measures short vs. long-term EMAs | Momentum/trend |
| Signal Line | EMA of MACD Line | Entry/exit timing |
| Histogram | Distance between MACD & Signal Line | Strength of market move |
Traders often combine MACD with RSI for a more complete picture. It’s reliable, visual, and ideal for spotting shifts in forex trends.
3.How to Analyze Forex Charts Effectively?
Reading Candlestick Pattern Signals
Candlestick patterns are one of the most visual and immediate ways to understand what price action is trying to tell you. These patterns aren’t just fancy shapes—they signal potential reversals, trend continuations, or market hesitation.
Some of the most reliable patterns include:
Doji – suggests market indecision; watch closely for next move
Engulfing Pattern – a strong reversal sign, especially when bullish or bearish
Hammer & Hanging Man – can signal exhaustion and price reversal
Morning Star / Evening Star – three-candle patterns that point to momentum shifts
Here’s a quick breakdown of key candlestick patterns and their signals:
| Pattern Name | Type | Signal Type |
|---|---|---|
| Hammer | Reversal | Bullish |
| Engulfing | Reversal | Bullish/Bearish |
| Doji | Neutral | Reversal Hint |
| Morning Star | Reversal | Bullish |
| Evening Star | Reversal | Bearish |
Expert Insight:
"Candlestick patterns aren’t magic—but when combined with other tools, they offer incredible timing power."
— Linda Raschke, veteran trader
Whether you're looking at a bullish engulfing or a sudden Doji, remember context is everything. Patterns near strong support zones or after long trends are much more telling.
Identifying Support and Resistance Levels
Support and resistance are like battleground zones where price tends to react, pause, or reverse. Learning to recognize these zones gives traders an edge—knowing when to enter or exit.
Here’s how to break it down:
Identify Key Price Reactions
Use past highs/lows as markers
Draw Horizontal Support/Resistance Lines
Especially around price zones with multiple touches
Apply Trendlines and Fibonacci Tools
Great for dynamic levels and retracement spotting
Watch for Breakouts and Retests
A breakout above resistance may turn that level into new support
These levels are not exact prices—they're zones. A resistance zone might sit between 1.1250–1.1280, where sellers consistently show up. A pivot point can reinforce a zone, while a trendline can add visual confidence.
Quick Tip: Support becomes more reliable the more times it holds. Same with resistance—if price fails to break it multiple times, it's likely strong.
Use them wisely, and your technical setups will start to “click” much more often.

4.Popular Forex Technical Strategies
Trend Following Strategy Explained
Trend following is a strategy built around one idea: follow the direction of the market. When prices are rising, you buy. When they’re falling, you sell. It’s simple in theory—but solid execution requires discipline and proper indicators.
Common indicators used:
Moving Averages (MA): Smooth out price data to highlight trend direction.
ADX (Average Directional Index): Measures trend strength.
Breakout Points: Signal the start of a new trend.
This strategy works well in strong markets with clear momentum. Long-term traders often favor it, but it can be adapted for short-term moves too. Remember, “the trend is your friend,” but only when you know how to read it.
Breakout Trading in Forex Markets
Breakout trading targets sharp price movements when currency pairs escape tight price zones. This typically occurs around resistance and support levels. Traders prepare to enter as soon as price "breaks out" of these key areas with high volume and volatility.
Here’s how it works:
Spot a consolidation zone – price moves within a narrow range.
Mark resistance and support lines – prepare for a potential breakout.
Set your entry just above resistance or below support.
Define a stop-loss just outside the opposite edge of the range.
Choose exit levels using prior highs/lows or set profit ratios.
Breakouts are especially common during major news releases. Volatile pairs like GBP/JPY or EUR/USD are favorite targets for breakout traders.
Using Fibonacci Retracement in Trading
Fibonacci retracement helps traders find potential reversal or continuation zones during a trend. Based on the famous golden ratio, this tool identifies where a price pullback might stop before resuming the trend.
When to Use:
After a strong upward or downward price move
During corrections, to plan re-entry
To set stop-loss or profit targets
Tip: Look for confluence—when a Fibonacci level overlaps with a support/resistance line or MA zone.
| Fibonacci Level | Ratio Value | Trading Signal Type |
|---|---|---|
| 38.2% | 0.382 | Mild pullback zone |
| 50.0% | 0.500 | Neutral, watch closely |
| 61.8% | 0.618 | Strong reversal potential |
This method works best in trending markets and pairs well with other tools like trendlines or RSI.
Swing Trading with Technical Tools
Swing trading is about capturing “swings” in market momentum—those short- to medium-term price moves that last from a couple of days to a couple of weeks. It suits traders who don’t have time to day trade but still want meaningful action.
Tools often used include:
Moving Averages to find trend direction
RSI or Stochastic Oscillators for timing entries
Trend Lines & Chart Patterns like flags and wedges
Here's a simple approach:
Spot a clear trend (up or down).
Wait for a pullback to support/resistance.
Use oscillators to confirm entry (e.g., RSI below 30 = oversold).
Set stop-loss just beyond the last swing high/low.
Exit at next resistance or when indicators reverse.
Swing trading with technical tools helps balance strategy and flexibility, making it ideal for part-time forex traders.
5. Which Is Better: Technical or Fundamental Analysis in Forex?
Pros and Cons of Technical Analysis
Technical analysis focuses on price charts, trends, and historical data to predict where the market might go. Traders lean on technical indicators like moving averages, oscillators, and support and resistance zones to make decisions without diving into economic reports.
But it's not all sunshine—there’s a real subjectivity to how traders interpret chart patterns and trend lines, and many tools are based on lagging indicators, which can leave you a step behind.
Pros
Fast decision-making with tools like RSI and MACD
Clear visual cues using candlestick patterns and trend lines
Ideal for short-term trading setups and risk management
Cons
Lagging indicators can delay signals
High dependence on predictive power of past prices
Ignores the impact of sudden news events
"Technical analysis gives you the how, but not always the why. That’s where it can trip you up," says Jacob Lin, FX strategist at TradeFocus.
Fundamental News Impact on Forex
Fundamental analysis takes a bigger picture view. It looks at economic indicators, interest rates, and central bank actions to understand a currency's true value. A surprise move by the Federal Reserve or an unexpected GDP drop? Expect currency pairs to react—big time.
This style is popular with traders who want to anticipate longer-term moves or react to short-term news-driven volatility. But keeping up with global news releases, inflation data, and geopolitical events can be a full-time job.
Key Drivers in Fundamental Forex Analysis:
| Economic Indicator | Impact on Forex | Frequency |
|---|---|---|
| Interest Rates | Strongest influence on value | Monthly/Quarterly |
| Inflation Data | Affects central bank policy | Monthly |
| Employment Reports | Drives expectations for growth | Monthly |
Monetary policy changes shift trends across major currency pairs
News volatility creates short-term trading opportunities
Accurate interpretation requires understanding macroeconomic context
“Fundamentals are the engine. They might not move fast, but they drive the direction,” says Carla Singh, currency market analyst.
6.Technical Analysis Tools for Forex Traders
Best Charting Software for Forex
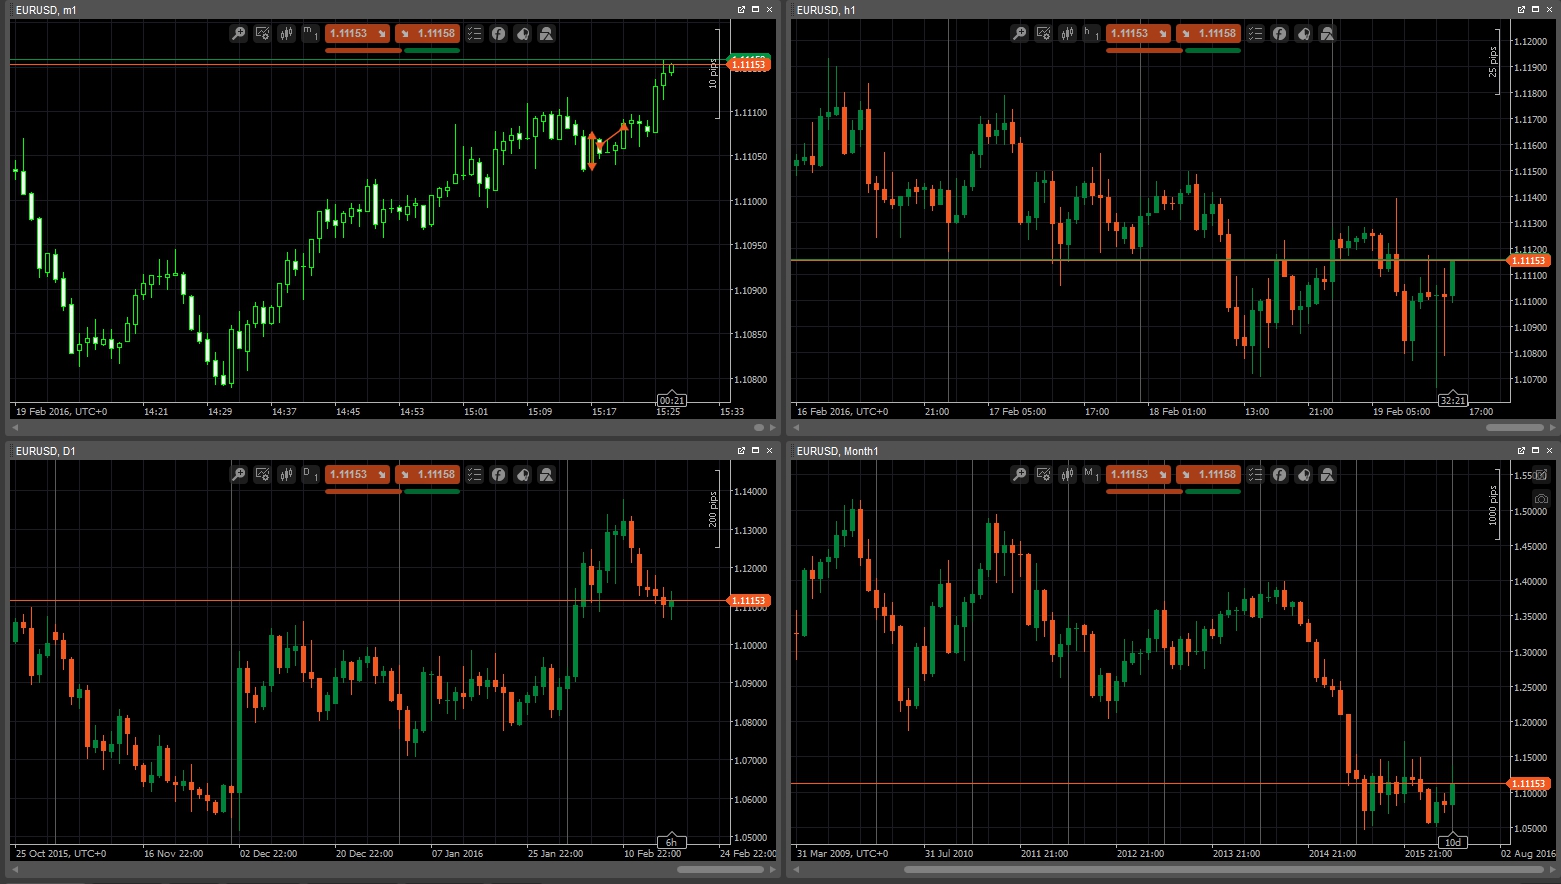
Solid charting software is the lifeblood of technical analysis in Forex. Whether you're watching EUR/USD or GBP/JPY, good tools help you interpret price action in real time.
Here’s what the best charting platforms typically offer:
Live market data for accurate decision-making
Dozens of customizable technical indicators
Multi-timeframe chart views
Drawing tools for trendlines, channels, and Fibonacci levels
Easy broker integration for executing trades
Below is a comparison of top Forex charting software:
| Charting Software | Timeframe Options | Built-in Indicators | Broker Integration |
|---|---|---|---|
| MetaTrader 5 | 21 | 80+ | Yes |
| TradingView | Unlimited | 100+ | Via API |
| NinjaTrader | 10 | 150+ | Limited |
MetaTrader is ideal for serious execution; TradingView excels at strategy visualization. NinjaTrader is a bit niche but powerful if you're into scalping or automation.
MetaTrader vs TradingView Tools
Let’s break down two Forex powerhouses: MetaTrader and TradingView. Both platforms dominate the charting world—but they serve different types of traders.
MetaTrader (MT4/MT5):
Super popular with Forex traders thanks to its deep broker integration.
Perfect for automated trading via EAs (Expert Advisors).
Desktop-first design, with mobile support.
Packed with classic indicators and strong backtesting.
TradingView:
100% web-based, with intuitive drag-and-drop features.
Huge social trading community.
Cloud-saving lets you access charts anywhere.
Gorgeous visuals, especially for multi-asset comparison.
Still unsure? Ask yourself:
Want fast execution with a broker? Go MetaTrader.
Want sleek, clean charts and idea sharing? Go TradingView.
Whichever you choose, both platforms are robust for technical analysis in Forex.
Mobile Apps for Technical Analysis
We all get stuck in traffic, long lines, or waiting for coffee. That’s why mobile apps for technical analysis are a game-changer in Forex.
MetaTrader Mobile
Allows full access to your MT4/MT5 accounts.
View real-time quotes, execute trades, and analyze charts.
Includes all standard indicators and timeframes.
TradingView App
Cleanest UI out there for mobile charting.
Syncs seamlessly with your desktop layout.
Excellent for setting price alerts and sketching chart ideas.
ThinkTrader
Over 100 indicators, a strong contender for mobile pros.
Multi-chart views let you analyze several pairs at once.
Intuitive design tailored for fast decision-making.
Whether you’re scalping during lunch or checking a trendline before bed, these mobile apps keep you connected to the Forex markets with full technical firepower.
7.Can Technical Analysis Improve Your Forex Trading Success?
Backtesting Technical Strategies in Forex
Backtesting is one of the most effective ways to evaluate whether your technical strategy holds water before committing real capital. By using historical data to simulate past trades, traders gain insight into how their system might perform under different market conditions.
Algorithmic trading systems thrive on robust backtesting for precision.
Optimizing strategies with varied indicators across different currency pairs improves reliability.
Backtesting helps identify overfitting issues and unrealistic expectations early.
Whether you're testing a simple moving average crossover or a complex multi-indicator setup, always simulate over different volatility cycles. This gives you a clearer idea of long-term trading performance and risk exposure.
Setting Realistic Trading Expectations
Let’s be real — if you're expecting to double your account every week, you're setting yourself up for disappointment. Successful forex trading starts with having realistic expectations based on trading goals, market volatility, and a healthy understanding of your own risk tolerance.
Create a plan that defines profit targets and acceptable drawdowns.
Focus on consistency, not just short bursts of wins.
Use performance benchmarks instead of comparing with social media hype.
"Having a long-term view in trading isn’t optional—it’s essential. Short-term wins are fun, but long-term consistency is where wealth is built."
— Linda Raschke, veteran trader and author
Traders who stay grounded tend to make better decisions during stressful times — and that matters a lot more than chasing quick profits.
Risk Management with Technical Tools
This is where many traders sink. You can have a killer entry strategy, but without solid risk management, you’re gambling — not trading. The beauty of technical tools is they give you the precision needed to control risk effectively.
Use stop-loss orders based on support and resistance levels, not emotions.
Adjust position sizing according to trade risk and overall portfolio exposure.
Evaluate leverage and margin usage carefully to avoid forced exits.
Apply volatility-based indicators like ATR to calculate safe trade ranges.
Example Strategy:
If EUR/USD has high volatility, using wider stop-losses and smaller position sizes is smarter than trying to scalp every move.
When your risk/reward ratio is favorable (say, 1:2 or better), even a 40% win rate can be profitable over time.
Tracking Performance Over Time
You can’t improve what you don’t measure. This is where performance tracking becomes a game changer. By keeping a detailed trading journal, traders can review their past trades, identify weaknesses, and improve over time.
Below is a table summarizing key metrics to monitor:
| Metric | What It Measures | Ideal Range |
|---|---|---|
| Win Rate (%) | Percentage of winning trades | 50–70% |
| Drawdown (%) | Peak-to-trough loss | Less than 20% |
| Profit Factor | Profit vs. loss ratio | Above 1.5 |
| Equity Curve Slope | Account growth consistency | Smooth, steady rise |
Traders who regularly analyze their equity curve, drawdowns, and profit/loss ratios are far more likely to spot patterns—both good and bad. Keeping performance reports weekly or monthly supports better decision-making and long-term consistency.
Conclusion
Wrapping your head around forex trading without technical analysis is like trying to drive blindfolded—you might move, but you won’t go far. The tools, patterns, and strategies you’ve just learned about give you a real shot at making smarter, faster, more confident trades.
As John Murphy once said, “Charts are like maps—use them right, and you won’t get lost.” So fire up your charts, test a strategy, and see how far a little technical know-how can take you.
There is no single "best" indicator for all traders. However, commonly favored indicators include Moving Averages, RSI (Relative Strength Index), and MACD due to their versatility and simplicity. Many traders combine multiple indicators for confirmation signals.
Technical analysis does not predict with certainty—it identifies high-probability scenarios based on historical data. It helps traders make informed decisions, but external factors like economic news or geopolitical events can still cause unexpected price movements.
Line charts – Simplest form, connecting closing prices
Bar charts – Show open, high, low, close (OHLC)
Candlestick charts – Provide visual insight into price patterns
Renko and Heikin-Ashi – Less common, but used for trend clarity
Yes, but with guidance. Beginners should start with basic indicators like moving averages and gradually explore chart patterns. It’s important to practice with demo accounts and avoid overloading on too many tools at once.
The Relative Strength Index (RSI) measures the strength and speed of price movements. It ranges from 0 to 100:RSI can help identify potential trend reversals or entry points.
Readings above 70 suggest an overbought market
Readings below 30 suggest an oversold market
MetaTrader 4/5 – Industry-standard platforms with custom indicators
TradingView – Web-based platform with advanced charting
cTrader – Known for its intuitive UI and analytics
Forex Factory Calendar – Often used alongside charts for event-based trading
The frequency depends on your trading style:Consistency is more important than frequency—routine analysis helps build better strategies.
Day traders analyze charts multiple times daily
Swing traders may check signals once or twice a day
Position traders might do analysis weekly

